


UX Collective
8 (more) tips to quickly improve your UI
6 min · · More small and easy to put into practice tips to improve your designs. · Shared by 98, including CSS Weekly, Oliver Raduner, Mark Pitman, David Hellmann, Adham Dannaway

KDnuggets
Introduction to Pandas for Data Science
8 min · · The Pandas library is core to any Data Science work in Python. This introduction will walk you through the basics of data manipulating, and features many of Pandas important features. · Shared by 79, including Craig Brown, PhD, Mark Pitman, Carla Gentry 🎶


Fast Company
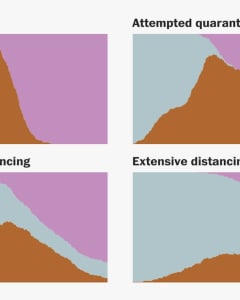
Move over data visualization. The era of ‘data simulation’ is here
7 min · · “Flatten the curve” was just the beginning. · Shared by 169, including Marc R Gagné MAPP, Bryan Onel, Guy Kawasaki, Birgit Schefer, 🇺🇦Evan Kirstel #B2B #TechFluencer, Stephanie A Kowalski, Marie-José Kolly, Mark Pitman, Rick King, Jose Luis Calvo, Stu Collett, Tom Connor, Bob Violino

The Washington Post
Why outbreaks like coronavirus spread exponentially, and how to “flatten the curve”
7 min · · Shared by 1366, including Steve Case, Vala Afshar, Hiroko Tabuchi, David Meerman Scott, Prof Michael E. Mann, 🇺🇦Evan Kirstel #B2B #TechFluencer, Tristan Harris, Mike Quindazzi, Henry Reich, Atul Gawande, Laura Shin, Brad Frost, George J Huba PhD, Jameson Lopp, Fanzo, Jeff Atwood, Rami Ismail (رامي), hiten.eth, anildash.com, Ryan Hoover

medium.com
The Architecture of a Data Visualization — Accurat studio
10 min · · Multilayered Storytelling through Info-spatial Compositions · Shared by 276, including Agustin, Katja Evertz, blinch, Data Science Renee, Fabrizio Bianchi, Mark Kaigwa, Dominik Grolimund, Javi Cantón @javicanton@mas.to, Jacob Jarnvall, Sascha Brossmann (he/him) 🇪🇺🇺🇦, Mara Averick, Nico Müller 🇺🇦, Mark Pitman, Nando 💪🇦🇺🇦🇷, Christopher Möller, von Moerenburgh, Luzius Meisser, Lluís Codina, Florian Hanke 🍎, Alex Barrera