Data Visualizations
Inspiration for visualizing data, concepts and theories. And on how to work with data and become a data scientist.
Collection by Katja Evertz


evolutionoftheweb.com
The evolution of the web
1 min · · Interactive infographic about the evolution of browsers and the web. This infographic features major web browsers since 1993 such as Mosaic, Netscape, Opera, Internet Explorer, Safari, Firefox, and Chrome, as well as key developments in web technologies such as HTML, CSS, and JavaScript. · Shared by 4191, including Brad Frost, Raphael Raue, René Clausen Nielsen, Leonardo Sumulong, Serge K. Keller ❦, Katja Evertz, Zain Fathoni, PotHix, Stephen C Sanders, Johannes Lenz, Matthieu de Luze, Dominik Grolimund, Ben Hibbs, Josep M. Ganyet, Philippe Surber, ɐpuɐʎᴉW ᴉʇɐʍɥǝN, Helmi, Mark Kaigwa, Yoav Ganbar (🥑 Builder.io/Qwik), Thomas Power

r2d3.us
A visual introduction to machine learning
5 min · · What is machine learning? See how it works with our animated data visualization. · Shared by 3976, including hardmaru, wahalulu@fosstodon.org Marck Vaisman, Mara Averick, designshard, Parin Vachhani, Rand Fishkin, Stowe Boyd, Gideonro, Justin Wolfers, Mike Tamir, PhD, Elijah Meeks, Data Science Renee, Kenneth Kalmer, Aleyda Solis 🇺🇦, Helen Yu, hakan, Chris Messina, 🇺🇦Evan Kirstel #B2B #TechFluencer, Kevin_Indig, Daniel Boos

The Washington Post
Why outbreaks like coronavirus spread exponentially, and how to “flatten the curve”
7 min · · Shared by 1366, including Steve Case, Vala Afshar, Hiroko Tabuchi, David Meerman Scott, Prof Michael E. Mann, 🇺🇦Evan Kirstel #B2B #TechFluencer, Tristan Harris, Mike Quindazzi, Henry Reich, Atul Gawande, Laura Shin, Brad Frost, George J Huba PhD, Jameson Lopp, Fanzo, Jeff Atwood, Rami Ismail (رامي), hiten.eth, anildash.com, Ryan Hoover


The Pudding
Why the super rich are inevitable
5 min · · Why some mathematicians argue the economy is designed to create a few super rich people – unless we stop it. · Shared by 1306, including Dr. Alec Couros, Matt Daniels, Martina Pugliese, Ferit (at 🏠) 🌙, Alex B., Kai Biermann, Nir Eyal, Colin Wright, Katja Evertz, Paul Kedrosky, Stef Walter, Gisele Navarro, Craig Mod, Nico Müller 🇺🇦, Cory Doctorow @pluralistic@mamot.fr, Bruce Lawson, Florian Hanke 🍎


Neal Agarwal
The Deep Sea
· Scroll down the deep sea in this interactive page. · Shared by 1021, including David Smith, Dorothy Bishop, Dr. Jacquelyn Gill, Chris Heilmann codepo8@toot.cafe, Jessica Hische, Tim Bray, Nathan Yau, Richard Dawkins, Delip Rao e/σ, Emmy van Deurzen☀️🌍 🌻🌹🌳🇪🇺🇫🇷🇳🇱🇬🇧🇺🇸⭐️, Steve Silberman, Brad Frost, Anita Leirfall, Mathew Ingram, Liam Bright, Jerry Saltz, Klaus Eck, Edward Tufte, Ferris Jabr


The New York Times
How the Virus Got Out
7 min · · We analyzed the movements of hundreds of millions of people to show why the most extensive travel restrictions to stop an outbreak in human history haven’t been enough. · Shared by 974, including Chris Fralic, Eric Topol, 艾未未 Ai Weiwei, zooko❤ⓩ🛡🦓🦓🦓, Kevin Roose, Carl Zimmer, Christopher Mims 🤌, Jon Matonis, Renee DiResta, Niall Ferguson, Matt Goodwin, Carla Gentry 🎶, Johnny Harris, Mathew Ingram, Dr. Manu Kumar, Azeem Azhar, R.NFT R “Ray” Wang 王瑞光 #1A #AI, Stefan Ottlitz @hierprivat@mastodon.social, hardmaru, Aral Balkan


Know Your Meme
Where Do Memes Come From? The Top Platforms From 2010-2022
20+ min · · From the rise of TikTok to the Boomerification of Facebook, our data tells many important stories. We take a look back at the history of meme origins from the last decade-plus to infer how the… · Shared by 802, including Gisele Navarro, Digg, Colin Wright, Matt Navarra, Alan See, Katja Evertz, Paolo Pedercini 🥶, Brad Frost, Merkstatt@troet.cafe 📯, @annagrigoryan.bsky.social, Tactical Tech, Leni "Lee" Krsova ⚔️


The New Yorker
What Data Can’t Do
8 min · · When it comes to people—and policy—numbers are both powerful and perilous. · Shared by 720, including 👨🏻💻☕️, Satya Patel, Helen De Cruz, Ronald van Loon, Nige Roberts-Willson, Aleksandra Wisniewska, Chris Moran, Michael Seemann, Tim Harford, Mike Tamir, PhD, Bob E. Hayes, Abeba Birhane, Kyle Bunch, Marie-José Kolly, David Smith, Eric Topol, Mirko Lorenz, Brian Ahier, Kevin Marks 🏠kevinmarks.com xoxo.zone/@KevinMarks, Tactical Tech


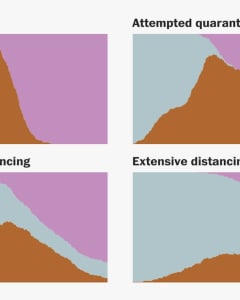
Vox
How canceled events and self quarantines save lives, in one chart
5 min · · This is how we all help slow the spread of coronavirus. · Shared by 687, including Mathieu von Rohr, Ezra Klein, Allison Arieff, Rutger Bregman, 🇺🇦Evan Kirstel #B2B #TechFluencer, Frank Gruber, Julia Belluz, J. P. Gownder (கவுண்டர்), HeidiCohen - Top Global Marketer, Klaus Eck, Dr. Kiki Sanford, Thomas Fuchs , Kainaz Amaria, Frederic Filloux, Brian D. Earp, Ph.D., Jenny Halasz, C. Dutilh Novaes akademienl.social/@cdutilhnovaes, Anita Zielina, Carl T. Bergstrom, Gerd Leonhard


Visual Capitalist
How COVID-19 Has Impacted Media Consumption, by Generation
16+ min · · This visualization explores how each generation's media consumption is changing amid the frenzy of pandemic-induced quarantines. · Shared by 684, including Glen Gilmore #MWC23, Helen Yu, Tom Raftery, LARRY ELKAN, Michelle Tandler, Dr. Marigo Raftopoulos, 🇺🇦Evan Kirstel #B2B #TechFluencer, Thomas Power, Vala Afshar, Dr. Marcell Vollmer 🇺🇦 #StaySafe #VivaTech, Antonio Vieira Santos, Liliane Ferrari ™, Marc R Gagné MAPP, Michelle Garrett, George J Huba PhD, Matt Navarra, Mari Smith, Theodora (Theo) Lau - 劉䂀曼 🌻, Tamara Schenk, ⭐️Danielle Guzman ⭐️


Quanta Magazine
The Map of Mathematics
· Explore our surprisingly simple, absurdly ambitious and necessarily incomplete guide to the boundless mathematical universe. · Shared by 680, including Brian Laung Aoaeh, CFA, Liv 😷, Fabricio Teixeira, Katja Evertz, Logical Analysis, luis antónio santos, Nico Müller 🇺🇦, Oleg Baskov, William El Kaim, Ziad Shihab, Merkstatt@troet.cafe 📯, Kat, Cameron Yick ~ @hydrosquall@vis.social on mastodon, Matthias Lampe, Guy Longworth, Jennifer Ouellette, Mark Brandon, Dr. Ganapathi Pulipaka 🇺🇸, Kim Albrecht @vis.social/@kim, Philipp Laurim
mkorostoff.github.io
Wealth, shown to scale
· Wealth inequality in the United States is out of control. Here we visualize the issue in a unique way. · Shared by 665, including Eli Pariser | @elipariser@mastodon.social, Audrey Watters, Julie Zhuo, Ellen Shapiro, Avinash Kaushik, Guy Longworth, Jill I-Am-Permanently-OFF-Bird-Site Duffy, Olúfẹ́mi O. Táíwò, Robert Lepenies, Lynne Murphy, Jennifer Stirrup #MBA Topics: #AI #Data #Strategy, Peter Steinberger, ✕✕✕✕✕, Damien de France 🌍 🕊️🇺🇦, Kelsey D. Atherton, now available on Bluesky, Eric Holthaus, jesse squires 🏴, Scott Santens, Jeff Atwood, Tommy Walker


Moz
What Are the Best Tools for Storytelling With Data Visualization?
5 min · · Charts and infographics can be pretty, but if they aren’t also properly breaking down data in a way that makes an impact on the audience, they are likely not worth the time and effort. In this piece,… · Shared by 656, including Kendra Lee, Mario Clemente, Katja Evertz, Thomas Pleil, Robert Rose, Stephanie A Kowalski, 🇺🇦Evan Kirstel #B2B #TechFluencer

bnonews.com
Tracking coronavirus: Map, data and timeline
· The table below shows confirmed cases of coronavirus (2019-nCoV) in China and other countries. To see a distribution map and a timeline, scroll down. There are currently 16,758 confirmed cases worldwide, including 361 fatalities. We need your help. Click here to join Patreon to support our work. Last update: 2 February 2020 at 5:08 p.m. […] · Shared by 651, including Yvette d’Entremont (@thescibabe.bsky.social), Jean-François Gariépy 🧬, Katja Evertz, SusanaDeLeón, MD, Thomas Power, Bob Gourley, Danielle Fong 🙋🏻♀️, Ryan Selkis 🪳, Tara Imani, AIA, 艾未未 Ai Weiwei, @augieray@mastodon.social, 🇺🇦Evan Kirstel #B2B #TechFluencer, Christina Hoff Sommers, DHH, Tuur Demeester, Brian Laung Aoaeh, CFA, Nando 💪🇦🇺🇦🇷

Visual Capitalist
Long Waves: The History of Innovation Cycles
11+ min · · Creative destruction plays a key role in entrepreneurship and economic development. Coined by economist Joseph Schumpeter in 1942, the theory of “creative destruction” suggests that business cycles… · Shared by 628, including Elinor Stutz, ipfconline in vacation mode :) will be back Sept.4, Harold Sinnott, Dr. Marcell Vollmer 🇺🇦 #StaySafe #VivaTech, Giuliano Liguori, Michael Fisher, Prof. Sally Eaves, Linda Grasso, Matteo Carbone, James Gingerich #B2B #Technology #Influencer, Damien de France 🌍 🕊️🇺🇦, LARRY ELKAN, Theodora (Theo) Lau - 劉䂀曼 🌻, Antonio Grasso, Andreas Staub, Dr. Ganapathi Pulipaka 🇺🇸, John Hagel, Glen Gilmore #MWC23, Nicolas Babin, 🇺🇦Evan Kirstel #B2B #TechFluencer

opendatascience.com
12 Excellent Datasets for Data Visualization in 2022
4 min · · Data visualization requires quality data just as much as any other project. Finding data visualization datasets can be frustrating, but these datasets offer excellent resources to support… · Shared by 590, including Kirk Borne, Katja Evertz, Stephanie A Kowalski