Data Visualizations
Inspiration for visualizing data, concepts and theories. And on how to work with data and become a data scientist.
Collection by Katja Evertz


nathanrooy.github.io
A visual book recommender
5 min · · Recreating the used bookstore experience via contrastive learning, t-SNE, and 100M book reviews. · Shared by 211, including Katja Evertz


Nathan Yau
100 visualizations from a single dataset with 6 data points
· The structure of a dataset can help you pick a visualization method or chart type, but it only takes you part of the way there. To demonstrate, Ferdio started with a simple dataset with six data po… · Shared by 123, including Esther Schindler

lindseypoulter.com
Dashboard of the Present Future
· Dashboard of the Present Future for the World Data Visualization Prize. Created by Lindsey Poulter · Shared by 60, including Nico Müller 🇺🇦


noteable.io
Data Visualization - 6 Tips For Effectively Visualizing Data
6 min · · Data Visualization: Bar charts and line charts are the most popular ways to visualize your data. And for a good reason. Thanks to tools like Excel and Google Sheets, they are quick for anyone to make… · Shared by 206, including sircharlsxavier, Katja Evertz, Elijah Meeks, Ines Bieler


Visual Capitalist
Our Top 22 Visualizations of 2022
20+ min · · The world was a complex and volatile place in 2022. In our signature style—combining art, data, and storytelling—we helped millions of people make sens · Shared by 502, including Katja Evertz, Howard Getson, Matt Shaffer
Nathan Yau
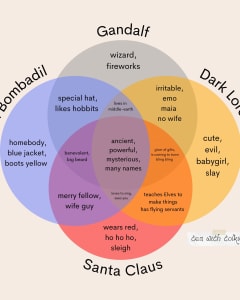
Lord of the Rings and Santa Venn diagram
· Kaitlyn Facista, of Tea with Tolkien, made a four-part Venn diagram that shows the intersection between Gandalf, Dark Lord Sauron, and Tom Bombadil from Lord of the Rings and Santa Claus. · Shared by 75, including Katja Evertz


The Pudding
Why the super rich are inevitable
5 min · · Why some mathematicians argue the economy is designed to create a few super rich people – unless we stop it. · Shared by 1305, including Dr. Alec Couros, Matt Daniels, Martina Pugliese, Ferit (at 🏠) 🌙, Alex B., Kai Biermann, Nir Eyal, Colin Wright, Katja Evertz, Paul Kedrosky, Stef Walter, Gisele Navarro, Craig Mod, Nico Müller 🇺🇦, Cory Doctorow @pluralistic@mamot.fr, Bruce Lawson, Florian Hanke 🍎

Datawrapper
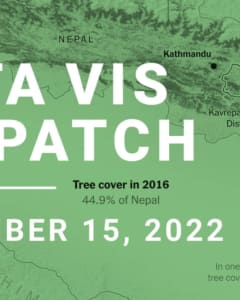
Data Vis Dispatch, November 15
13+ min · · The best of last week’s big and small data visualizations · Shared by 25, including Katja Evertz


Data Visualization Society
Five Inspiring Data Visualization Galleries
4 min · · If designed with care and preparation, data visualization can immensely improve viewers’ understanding of what is happening. Yes, data exploration and data analysis are essential, but data… · Shared by 45, including Katja Evertz


Know Your Meme
Where Do Memes Come From? The Top Platforms From 2010-2022
20+ min · · From the rise of TikTok to the Boomerification of Facebook, our data tells many important stories. We take a look back at the history of meme origins from the last decade-plus to infer how the… · Shared by 802, including Gisele Navarro, Digg, Colin Wright, Matt Navarra, Alan See, Katja Evertz, Paolo Pedercini 🥶, Brad Frost, Merkstatt@troet.cafe 📯, @annagrigoryan.bsky.social, Tactical Tech, Leni "Lee" Krsova ⚔️

Data Visualization Society
The Declutter and Focus Concepts – Popular Academic Opinions or Effective Design Principles?
6 min · · Declutter and focus are two guidelines for creating clear and efficient visualizations. The declutter guideline suggests removing all the non-critical elements of the chart like gridlines, excessive… · Shared by 20, including Katja Evertz


Moz
What Are the Best Tools for Storytelling With Data Visualization?
5 min · · Charts and infographics can be pretty, but if they aren’t also properly breaking down data in a way that makes an impact on the audience, they are likely not worth the time and effort. In this piece,… · Shared by 656, including Kendra Lee, Mario Clemente, Katja Evertz, Thomas Pleil, Robert Rose, Stephanie A Kowalski, 🇺🇦Evan Kirstel #B2B #TechFluencer

opendatascience.com
12 Excellent Datasets for Data Visualization in 2022
4 min · · Data visualization requires quality data just as much as any other project. Finding data visualization datasets can be frustrating, but these datasets offer excellent resources to support… · Shared by 590, including Kirk Borne, Katja Evertz, Stephanie A Kowalski

Data Visualization Society
Timely Advice – How Long Does Dataviz Take?
16+ min · · Visualizing 3iap timesheets for 10 dataviz client projects. How much time goes into researching, data-wrangling, designing, and building different types of data visualizations? Every client asks, “How… · Shared by 51, including Nadieh Bremer, Alli Torban, Katja Evertz