


Notion
Notion – Login
1 min · · A new tool that blends your everyday work apps into one. It's a unified and collaborative workspace for you and your team · Shared by 2274, including Naval, Wes Bos, Andrew Wilkinson, hiten.eth, Michael Hyatt, swissmiss, OM, Jeff Atwood, Baratunde, Gary Vaynerchuk, 🇺🇦Evan Kirstel #B2B #TechFluencer, Julian Shapiro, erik spiekermann, @jason, Chris Coyier, Meltem Demirors, Ryan Hoover, Darren Rowse, Coronado 'Porch' Lindzon, tylercowen


The New York Times
How Much Worse the Coronavirus Could Get, in Charts
3 min · · Play with a model of coronavirus in the U.S. · Shared by 129, including Carl Zimmer, Klaus Eck, Carla Gentry 🎶, Javi Cantón @javicanton@mas.to, Lisa Gualtieri, Mathew Ingram, Jerry Saltz, Eric Topol, Azeem Azhar, Joshua Fields Millburn, Patrick Stotz, Reto Knutti, Kaspar Etter, Matthias Lampe, Simon Kuestenmacher, Frederic Filloux, Thomas Power, Scott Galloway, Marc Brupbacher, Mike Butcher


Our World in Data
Coronavirus Disease (COVID-19): Statistics and Research
· Coronavirus Disease (COVID-19) is a new global problem. This is our overview of the early research and data on the outbreak. We will extend this page in the days ahead. · Shared by 715, including Elad Gil, Patrick Collison, Jeff (Gutenberg Parenthesis) Jarvis, Carl Zimmer, Ryan Hoover, Max Roser, Aleyda Solis 🇺🇦, Tim Ferriss, George J Huba PhD, Ryan Selkis 🪳, Shervin 🚀 ∞ 🚄, Noah Smith, Mike Quindazzi, 艾未未 Ai Weiwei, Prof Steve Keen, Warren Whitlock, BrendanEich, Eric Topol, Brian Cox, Chris Hadfield

The New York Times
How Deadly Is Coronavirus? What We Know and What We Don’t
6 min · · The disease is still so new, and testing so limited, that the usual methods of analysis epidemiologists rely on are not yet viable. · Shared by 17, including Emily Badger, Heather Krause, We All Count, Javi Cantón @javicanton@mas.to, Sarah Kliff

jaimeserra-archivos.blogspot.com
Archivos. Jaime Serra
5 min · · Shared by 3, including Javi Cantón @javicanton@mas.to

medium.com
A picture may be worth a thousand words, but words frame a picture
11+ min · · TLDR: Visualization titles influence how people interpret, perceive bias in, and trust data visualizations. Our online studies show that… · Shared by 15, including Evan Sinar, PhD, Sophie Sparkes, Enrico Bertini, Multiple Views: Visualization Research Explained, Javi Cantón @javicanton@mas.to

statsandr.com
How to create a timeline of your CV in R
4 min · · A blog on statistics and R aiming at helping academics and professionals working with data to grasp important concepts in statistics and to apply them in R. · Shared by 2, including Javi Cantón @javicanton@mas.to


Follow me on Bluesky or Mastodon (see below)
Visualization often puts stories in perspective
1 min · · Following an election or primary race too closely is entertaining, but also stressing. Media organizations often read too much into individu... · Shared by 105, including Josh Rayman, Randy Olson, Data Science Renee, Stephanie A Kowalski, Ines Bieler, Javi Cantón @javicanton@mas.to, Thomas Power, Cole Knaflic, 🇺🇦Evan Kirstel #B2B #TechFluencer, Mark Kaigwa, Jonathan Kogan

medium.com
D3: Responsive and Dynamic Visualizations for Data and Other Easy Recipes
13+ min · · Graphs made fun…or at least easier · Shared by 3, including Javi Cantón @javicanton@mas.to


Visual Capitalist
Visualizing 200 Years of Systems of Government
9 min · · At the start of the 19th century, less than 1% of humanity lived under democratic rule. See how systems of government have changed over the last 200 years. · Shared by 13, including Javi Cantón @javicanton@mas.to, Azeem Azhar


Data Visualization Society
The Cycle of Encoding and Decoding
12+ min · · How does data visualization work? · Shared by 7, including Javi Cantón @javicanton@mas.to

Data Visualization Society
Visualizing The Movement Of Music Genres
6 min · · I was curious to explore the possibility of visualizing genre metadata, in order to get a better understanding of potential movements · Shared by 9, including Javi Cantón @javicanton@mas.to, luis antónio santos

Data Visualization Society
2019 Was the Year Data Visualization Hit the Mainstream
9 min · · From our president to our clothes to our books, this year showed that Dataviz has become an integral part of modern culture · Shared by 18, including Nadieh Bremer, Elijah Meeks, Oscar MacDonald, Thomas Power, Javi Cantón @javicanton@mas.to

Data Visualization Society
The Missing Legacy of Marie Neurath
20+ min · · Recognizing the co-creator of the Isotype as a data visualization pioneer. · Shared by 26, including Liam Bright, Max Roser, Olúfẹ́mi O. Táíwò, RJ Andrews, Elijah Meeks, Javi Cantón @javicanton@mas.to

Data Visualization Society
Florence Nightingale is a Design Hero
18+ min · · May her light forever shine bright · Shared by 46, including RJ Andrews, Javi Cantón @javicanton@mas.to
medium.com
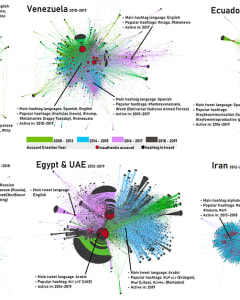
Watch six decade-long disinformation operations unfold in six minutes
15+ min · · Here’s a bird’s eye view of six state-backed information operations on Twitter, and how they evolved over the last decade. This research… · Shared by 15, including Javi Cantón @javicanton@mas.to, luis antónio santos, Luca Hammer